Operations Dashboard
The Operations Dashboard module is a powerful tool within our product that provides admin-level users with vital statistics related to TruCap+ parameters. This comprehensive documentation explains how the Operations Dashboard empowers users to effectively monitor the application's performance and gain valuable insights into key metrics.
Key Features of the Operations Dashboard
The Operations Dashboard encompasses the following key features:
Document Tracking: Users can monitor the number of received and processed documents, providing real-time insights into the overall document flow.
Processing Stages: The dashboard displays the number of documents in different processing stages, allowing users to identify bottlenecks and optimize workflows.
Notification Alerts: Admin-level users receive notification alerts on the dashboard, ensuring prompt response to important events or issues.
User Activity: The dashboard shows the number of active users, facilitating resource allocation and user management.
Accessing Operations Dashboard
To access the Operations Dashboard page, follow these steps:
-
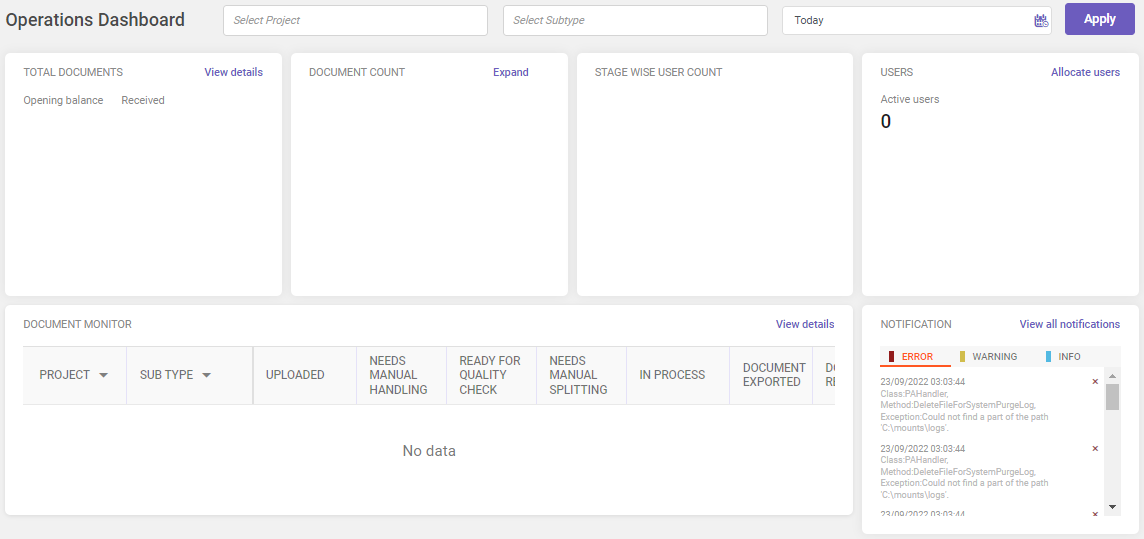
In the main menu, under Document Monitoring, click Operations Dashboard. The Operations Dashboard page opens.

-
Select the required project and subtype (or multiple projects and subtypes) from the drop-down to view the records for a pre-defined duration or use the
 icon to specify the required duration and then click Apply. All records matching the given criteria are displayed on the operations dashboard screen.
Note:
It is mandatory to select Project to display the records.
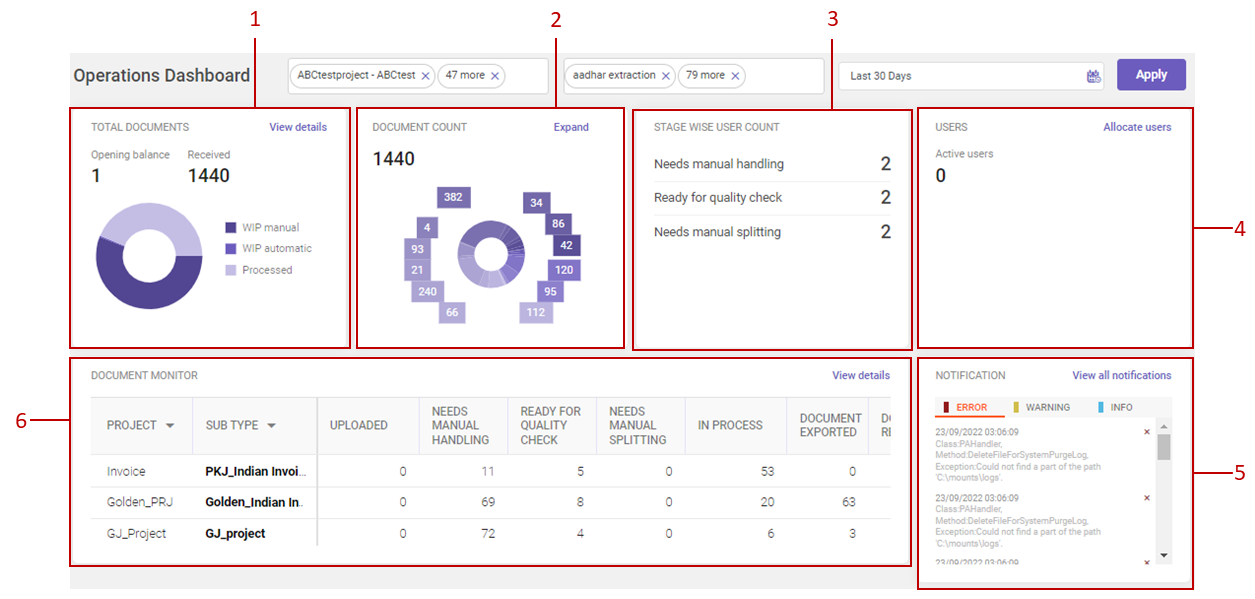
On the Operations Dashboard, the following parameters are displayed.
|
# |
DESCRIPTION |
|---|---|
|
1 |
Total Documents: This section provides information about the total number of documents received for the selected project. It also presents a graphical representation of documents being processed and those undergoing processing. By clicking the View details link, you can access the document monitor page for more detailed information about these documents. |
|
2 |
Document Count: This section offers a graphical overview of the received documents. Click on the Expand link to view individual document counts for the selected projects. |
|
3 |
Stage Wise User Count: Here, you'll find data about the number of individual users needed to process documents at various stages, including manual handling, quality check, and manual splitting. |
|
4 |
Users: This section provides data about currently active users, along with their names and assigned roles. By clicking on Allocate users you can assign documents for processing. (Refer Allocating users.) |
|
5 |
Notification: In this section, you can access notification alerts categorized into three types: Error, Warning, and Info. Each tab displays the last 10 notifications. To view all notifications grouped under different categories, click View all notifications. (Refer Notifications.) |
|
6 |
Document Monitor: This section provides collaborative data about the status of the documents for all the selected projects. To view data for a particular project, click the drop-down next to the Project header to search or select the required project. Click on any document subtype to view the subtype detail pane. In the detail pane, under the Document ID column, click In the Next Action column, you can view the document's status, including awaiting manual inspection, quality check, or data export or to view the exported or ready to export data. Note Clicking View opens the extraction results for exported documents in a new, non-editable tab dedicated to viewing. Click on the View details link to view the document monitor page for more information about the documents. |
 to view the document-specific information for the respective document.